One of data analysis’s most poetic features is that it often involves the aggregation of many individual observations to offer a broad view of some of the world’s biggest issues. And among the charts and graphics featured in the Chicago Booth ReviewSpring 2019 issue of , a few stand out from this perspective:

  • An analysis of world governments’ programs to address climate change lets economists study the significance of one nation’s carbon tax—or measure the relative effectiveness of every known carbon tax across the world.
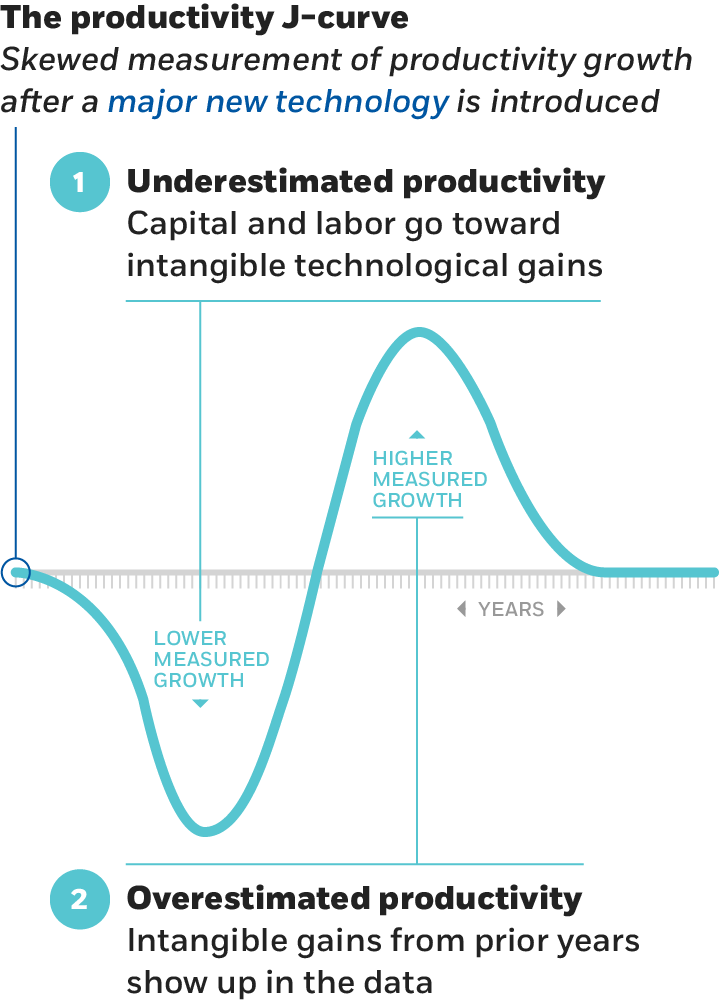
  • An exploration of productivity data allows researchers not only to observe changes within local cities’ economies but also to zoom out and see economic ripples spread across the United States.
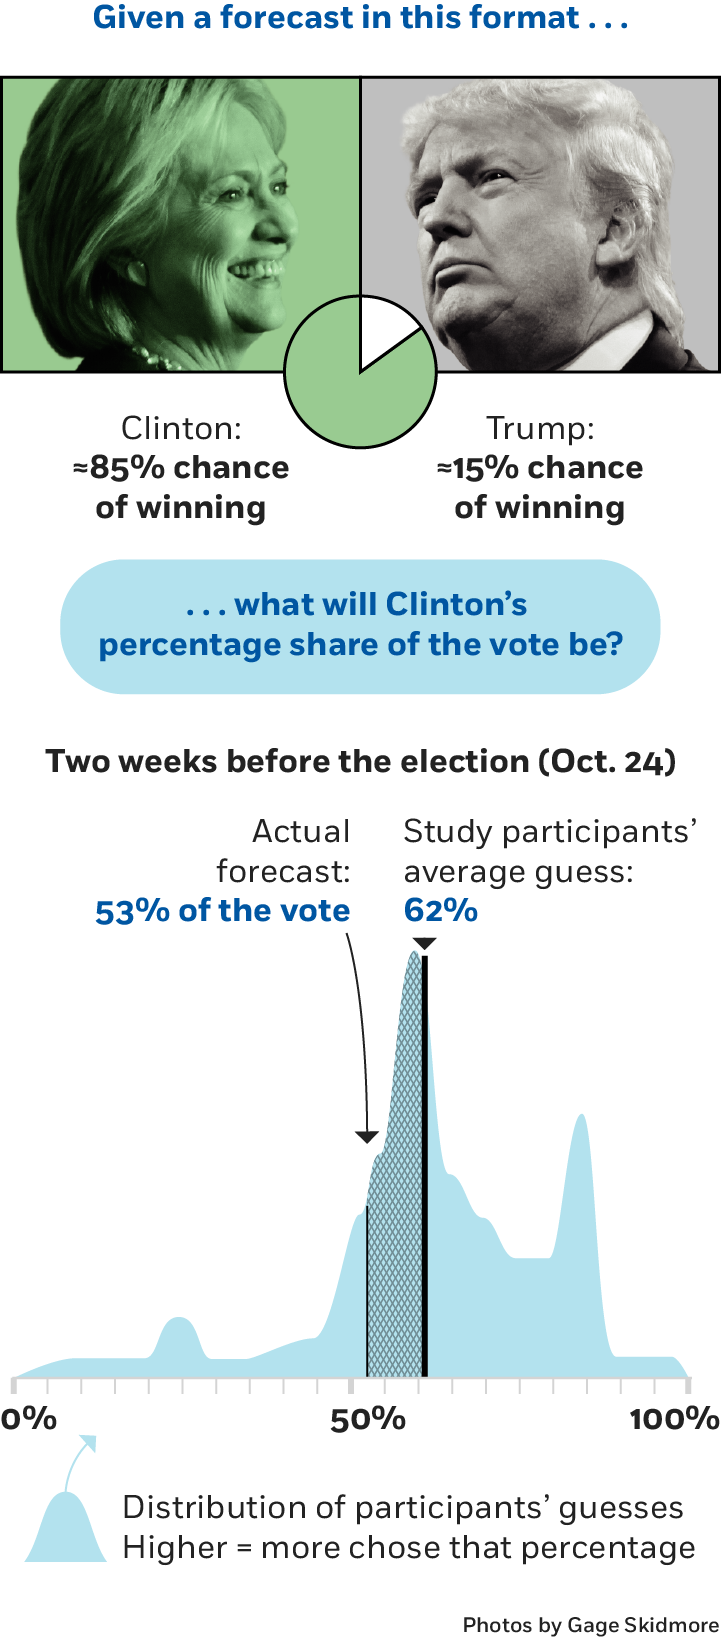
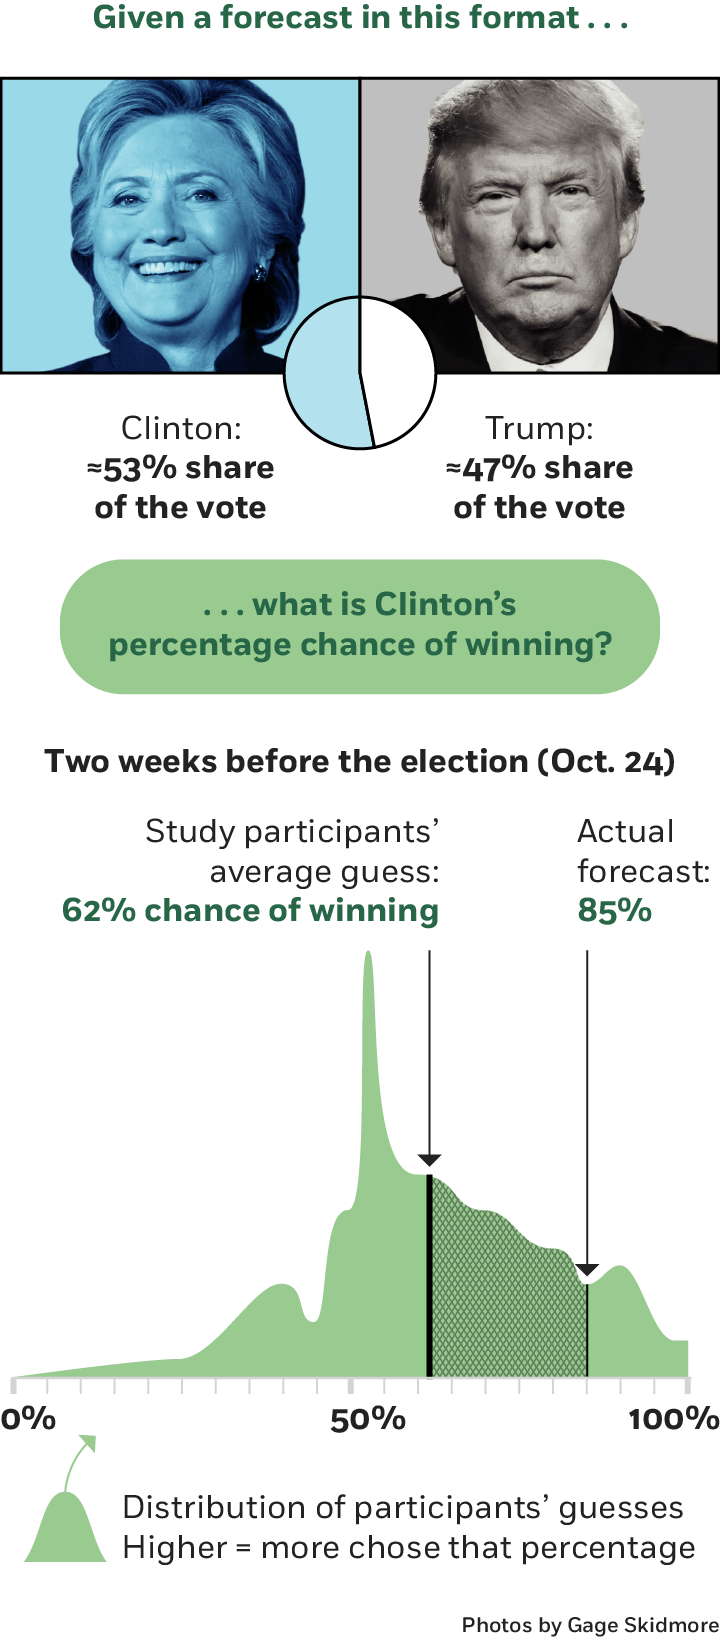
  • A study of election forecasting tests individuals’ working knowledge of statistics—and provides insight into how pollsters might be influencing voters’ perceptions of political races nationwide.

Check out visualizations of these and other data below—and peruse CBR’s spring issue for more research on topics of global, national, and local importance to business leaders and policy makers.

The tax that could save the world

According to the US National Oceanic and Atmospheric Administration, carbon stored in the Earth’s atmosphere is at its highest level in 800,000 years. The effects of the warming atmosphere will be felt more quickly than anticipated, a United Nations scientific panel concluded last October, saying that without a global carbon tax to nudge individuals and companies into action, any temperature target will be exponentially harder to meet. Twenty-six countries and provinces have implemented some form of carbon tax, according to the World Bank, and there are another 25 emissions-trading systems. But these efforts address only a small fraction of global carbon emissions.

Don’t write off a ‘failed’ entrepreneur

Although failure is unpleasant, Chicago Booth’s Waverly Deutsch argues it is also a critical part of innovation entrepreneurship, which is in turn critical to economic growth. She cites analysis of the US Bureau of Labor’s Business Dynamics Statistics data set by Tim Kane for the Ewing Marion Kauffman Foundation that indicates companies in their first year of existence have created an average of 3 million new jobs annually in the US since 1992. In most of those years, they have accounted for 100 percent of the net new jobs.

Who benefits most from productivity growth?

Chicago Booth’s Richard Hornbeck and University of California at Berkeley’s Enrico Moretti analyzed two decades of data from major US cities to quantify the effects of booming cities’ local productivity growth—not only the direct effects on people living in those cities, but also the indirect effects on people elsewhere. Allowing for trade-offs between salary and cost-of-living increases, as well as unequal distribution of benefits across different groups, the researchers find that low-skilled workers gained the most from local productivity growth.

How opinion polls are presented affects how we understand them

In a study conducted during the run-up to the 2016 US presidential election—when Hillary Clinton was the front-runner—Chicago Booth’s Oleg Urminsky and Chinese University of Hong Kong’s Luxi Shen find that people misinterpreted two types of political forecasts. When they saw the statistical probability that Clinton would win and were then asked to estimate a corresponding percentage-point margin by which she would win, they overestimated. And flipped the other way around, when they were given Clinton’s projected margin of victory, they underestimated her chances of winning.

Why artificial intelligence isn’t boosting the economy—yet

Given the potential of artificial intelligence to transform any number of industries, why hasn’t it sped up economic growth? MIT’s Erik Brynjolfsson, MIT PhD candidate Daniel Rock, and Chicago Booth’s Chad Syverson find that it may yet—and that, in fact, productivity in the early years of the AI era looks much as it did following the introduction of three other general-purpose technologies: the steam engine, electricity, and the internal combustion engine. In these cases, the researchers find signs of what they call “the productivity J-curve,” a period in economic data when productivity growth is underestimated, followed by a period when it’s overestimated, as business knowledge, organization, and infrastructure catch up to the opportunities the new technology offers.

More from Chicago Booth Review

More from Chicago Booth

Your Privacy
We want to demonstrate our commitment to your privacy. Please review Chicago Booth's privacy notice, which provides information explaining how and why we collect particular information when you visit our website.