
The Equation: Are Supply Chains Holding Back Productivity Growth?
If some suppliers are innovating at a much faster pace than others, it can hinder an industry’s growth.
The Equation: Are Supply Chains Holding Back Productivity Growth?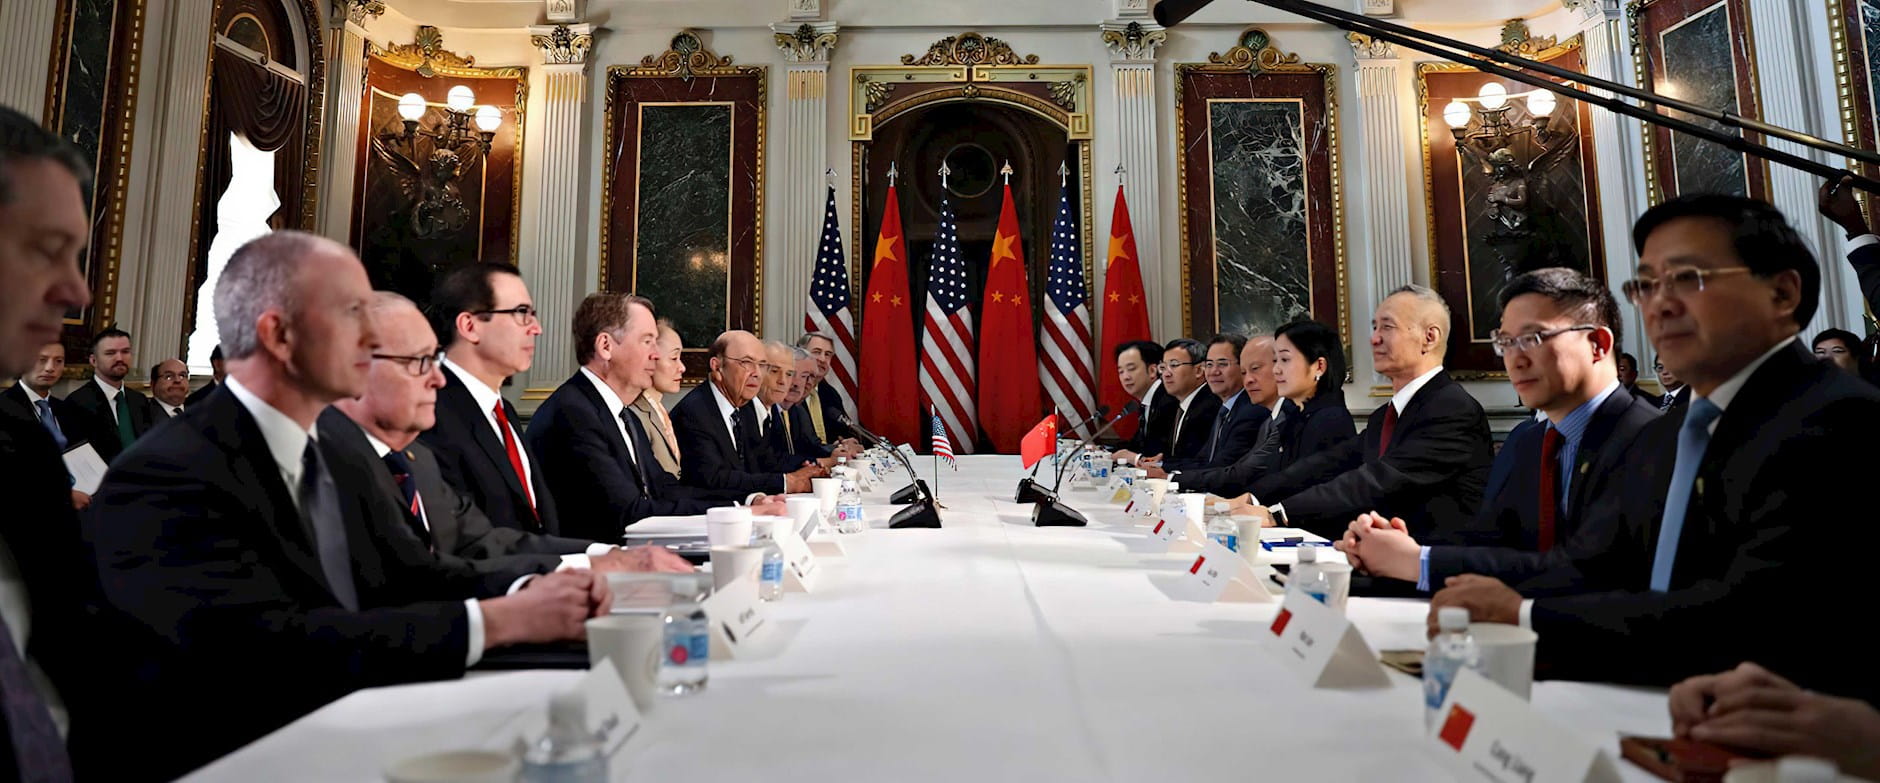
Associated Press
Trade-policy concerns became a major source of US stock market volatility in 2018. For example, the S&P 500 fell 2.5 percent on March 22, 2018, reacting to news about just-announced US tariffs on tens of billions of dollars of Chinese imports. Four days later, the index rose 2.7 percent on news the United States and China had begun trade negotiations. Still, tariffs and tariff threats between the two countries ratcheted upward over the next several months.
This prominence marks a striking change, as demonstrated in my research with Northwestern’s Scott R. Baker, Northwestern PhD candidate Marco Sammon, and Stanford’s Nicholas Bloom. We took a systematic look at the role of trade-policy developments and other news in large daily stock market moves. We first identified every daily move of 2.5 percent or more, up or down, in the US stock market. By this criterion, there were 1,112 large daily moves from 1900 to the end of 2018.
For each large move, we read next-day news articles in the Wall Street Journal to classify perceptions of what moved the market. The WSJ attributed seven of 1,103 large moves from 1900 to 2017 mainly to news about trade policy. But in a remarkable turnabout, the newspaper attributed three of nine large moves in 2018 to trade-policy news. From a historical perspective, the prominent role of trade policy in recent US stock market swings is highly unusual.
The chart below makes the point in a different way. Along with Baker, Bloom, and University of Chicago PhD candidate Kyle Kost, I used automated methods to identify articles about stock market volatility in 11 leading US newspapers, and to construct an equity market volatility (EMV) tracker. Our tracker performs well, in the sense that it moves closely with actual stock market volatility.
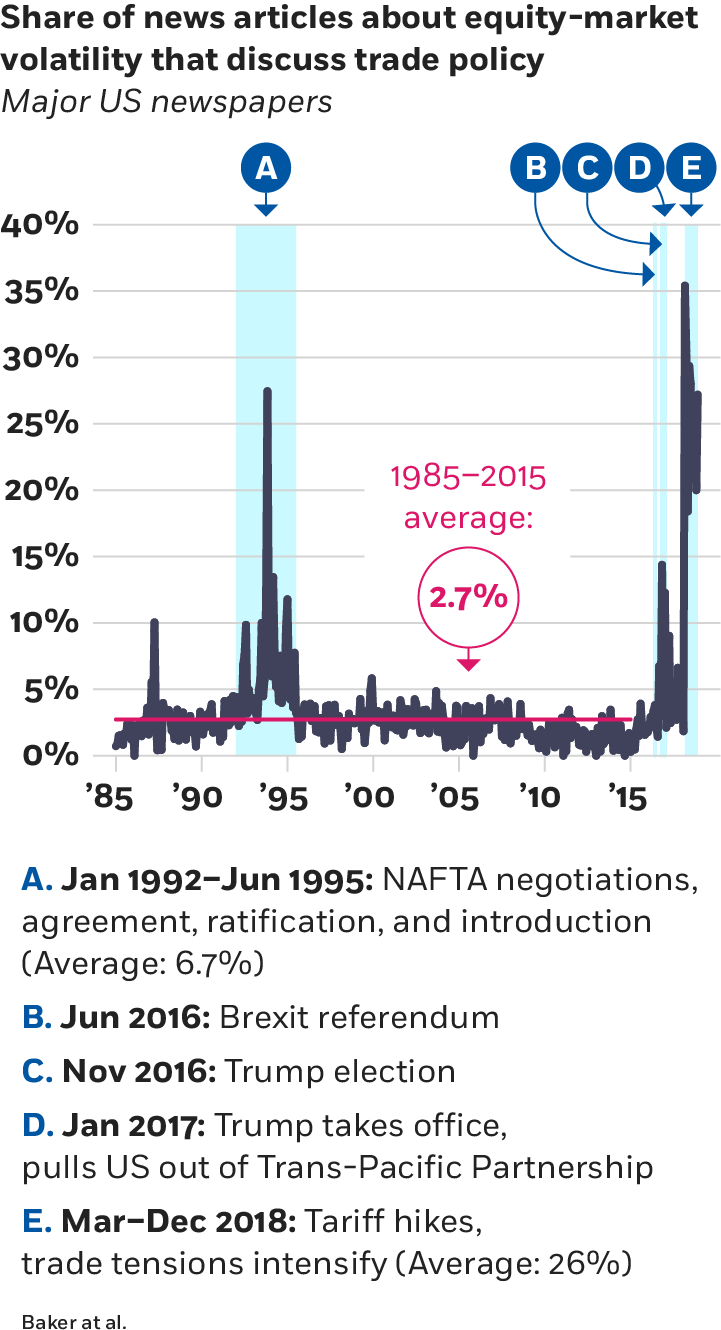
Parsing the text in the EMV articles, we quantified journalists’ perceptions of what drives volatility in equity returns. We then classified the drivers into about 30 categories, many of which pertain to particular types of policy, such as monetary policy or health-care policy. This let us assess the importance of each category to the average level of stock market volatility and to the market’s movements over time.
As the chart shows, between March and December of last year, trade policy received attention in 26 percent of articles about EMV in leading US newspapers. That’s almost a tenfold increase from 1985 to 2015, when trade policy drew note in a mere 2.7 percent of articles. Trade-policy concerns went from a virtual nonfactor in US EMV in recent decades to one of its leading sources.
The highly visible US–China dispute is only one of the heightened trade-policy concerns behind the pattern we chart. The US has also become enmeshed in trade-policy disputes with several other major trading partners since Donald Trump became president.
How much do these heightened concerns affect capital-investment expenditures by US businesses? Not as much as you might think.
Consider the Survey of Business Uncertainty (SBU), a national panel survey of American companies fielded monthly by the Federal Reserve Bank of Atlanta in partnership with Chicago Booth and Stanford. The SBU covers companies of all sizes in every major industry sector except agriculture and government. In this January’s SBU, we asked each company if tariff hikes and trade-policy tensions had caused it to alter its capital expenditures in 2018 and, if so, in which direction and by how much. We used the responses to estimate the net impact of tariff hikes and trade-policy tensions on US business investment in 2018. The table below summarizes the results.
How tariff hikes and trade-policy tensions affected US companies’ 2018 capital investment spending
Calculations using Survey of Business Uncertainty data, January 2019
| Private sector | Manufacturing | |
| Percentage change | -1.2% | -4.2% |
| Change in dollars | -$32.5 billion | -$22 billion |
| Survey responses | 337 | 95 |
Altig et al.; Survey of Business Uncertainty by Federal Reserve Bank of Atlanta, Stanford, Chicago Booth
We estimate that tariff hikes and trade-policy tensions lowered gross investment in 2018 by 1 percent in the private sector and 4 percent in the manufacturing sector. The larger response for manufacturing makes sense, given the sector’s relatively high exposure to international trade. In constructing these estimates, we considered companies that raised and lowered investment due to trade policy, and we weighted each company by its size.
To estimate the dollar impact of trade-policy developments, we multiplied the percentage effects by aggregate investment values. The resulting amounts for business investment in 2018—minus $32.5 billion for the private sector and $22 billion for manufacturing—are quite small compared to the $21 trillion size of the US economy.
We also asked forward-looking questions about the potential impact of trade-policy worries on future business investment. Companies anticipate somewhat larger, but still modest, effects of trade-policy developments on their capital expenditures this year. (The Atlanta Fed’s David Altig, Brent Meyer, and Nick Parker; Stanford’s Bloom; and I more fully discuss our conclusions on the basis of these forward-looking survey questions in a blog post for the Atlanta Fed, “Tariff Worries and US Business Investment, Take Two.”)
How can we square the small effects of trade-policy developments on US business investment with their recently large role in US stock market volatility? The answer has at least two parts. First, many companies listed on the US stock market, especially larger ones, have significant commercial interests abroad. These interests include foreign production facilities that export to the US, supply chains that run through China, and brand values and distribution networks in foreign economies. Tariffs and trade-war concerns put these commercial interests at risk and reduce their value. That, in turn, lowers the equity value of the company on the US stock market, even when it has little impact on the company’s US domestic operations.
Second, our survey evidence may not capture the indirect effects of trade policy on domestic investment. For example, when US tariff hikes weaken foreign economies, they also lower demand for US exports. Companies in the survey may attribute these demand declines to overall economic conditions rather than trade-policy developments.
What should we expect looking ahead? Trade-policy news and anxieties will remain an important source of stock market volatility so long as the US is embroiled in trade-policy conflicts with its major trading partners. Higher tariffs and an uncertain trade-policy outlook will also dampen domestic investment by US companies. But the effects on domestic business investment will stay small, barring a dramatic escalation of tariffs and other trade barriers.
Steven J. Davis is William H. Abbott Distinguished Service Professor of International Business and Economics at Chicago Booth and senior fellow at the Hoover Institution.
If some suppliers are innovating at a much faster pace than others, it can hinder an industry’s growth.
The Equation: Are Supply Chains Holding Back Productivity Growth?
Sohrab Ahmari discusses the complex relationship between capitalism, personal freedoms, and political power.
Capitalisn’t: When Capitalism Becomes Tyranny
Capitalisn’t podcast hosts Bethany McLean and Luigi Zingales sit down with MIT’s David Autor to discuss the impact of technology, labor markets, and immigration on wage inequality and the economy at large.
Capitalisn’t: Can Labor Markets Save Capitalism?Your Privacy
We want to demonstrate our commitment to your privacy. Please review Chicago Booth's privacy notice, which provides information explaining how and why we collect particular information when you visit our website.