
Women and Minority Investors Are Taking Matters into Their Own Hands
The VC industry continues to pay lip service to diversity.
Women and Minority Investors Are Taking Matters into Their Own HandsEntrepreneurs who seek angel and venture-capital funding are conditioned to project a “hockey stick” revenue curve. Most business plans I see at the angel- and seed-funding stage show companies hitting $50 million or more in revenue within a mere four or five years, hence their predicted sales charts look like hockey sticks. Is growth at that pace even possible? Is this just the wild optimism of the entrepreneur? The answer to both questions is yes.
A rare specimen
Groupon's early sales growth defied the odds.
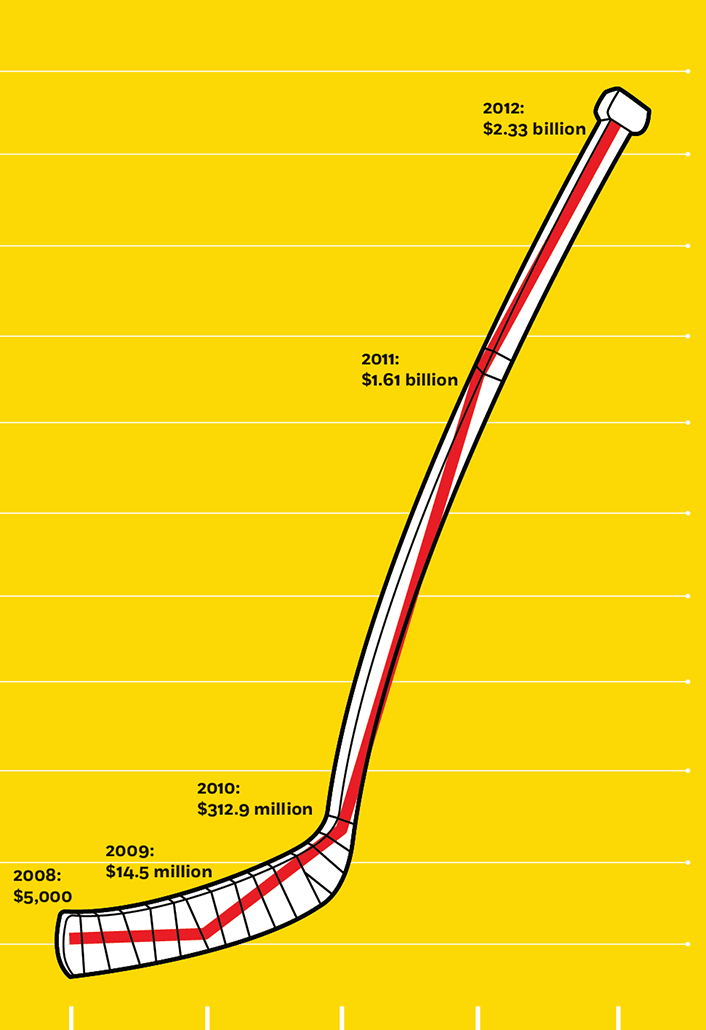
Looking at the first question—is it possible?—entrepreneurs can point to many examples. Groupon, founded in 2008, hit the billion-dollar mark in top-line sales in four years. Uber booked nearly $4 billion in gross revenue five years into its operations. (Of course, after it paid the drivers and accounted for all the discounted rides, the company really only took home $500 million.) Pure Storage, an enterprise storage start-up, passed the $100 million sales mark three years after launching its product, as did health-care technology company Evolent Health. As of July 2016, there were more than 170 privately held tech companies that have come to be known as unicorns—earning market valuations over the $1 billion mark. Frequently these firms have rapid sales growth into the double- and triple-digit millions within five years. But they are very much the exception, not the rule, and what these companies have in common is tens and hundreds of millions, sometimes billions, of dollars of venture-capital and private-equity backing.
All this outside capital allows these firms to overinvest in sales and marketing efforts, product development, and hiring, and even to make acquisitions to grab big chunks of revenue all at once. And the capital allows them to drive extremely rapid sales growth without having to worry about turning a profit. Seven years after being founded in 2009, Uber is still losing money. The ride-sharing giant reportedly lost $1.2 billion in the first half of 2016.
In the United States, more than 400,000 entrepreneurs launch new companies every year—these are employer firms, not simply people who begin to work for themselves as independent contractors. Of these companies, about 13 percent receive seed and early-stage capital from angel investors, with average deal sizes in the hundreds of thousands of dollars. However, only 0.6 percent of those 400,000 entrepreneurs will get early-stage funding from venture capitalists.
A more realistic sales picture
A relatively small number of entrepreneurs did well—after weathering the Great Recession.
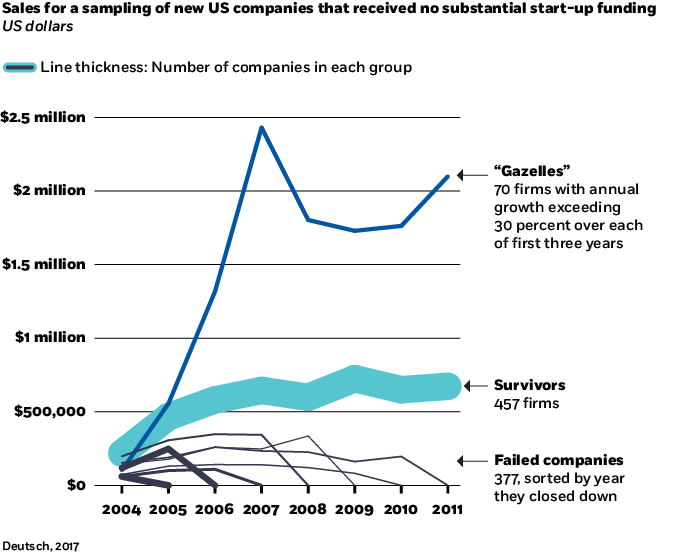
What does the sales trajectory look like for those 300,000-plus entrepreneurs who don’t receive the jump start of substantial outside capital? With the help of two analysts from Civis Analytics, I examined data from the Kauffman Firm Survey (KFS), collected annually until 2011 from nearly 5,000 new companies that started in 2004. These companies were randomly selected from the Dun & Bradstreet list of new business starts. Many of the companies never went on to hire employees or generate revenue, and data collection left some entries incomplete or inaccurate. After purging those from the data set, we were left with 1,007 companies. Only six in our sample reported raising outside equity capital, and the average amount raised of just under $55,000 led us to infer that this funding came from angel capital.
What we discovered was a sales pattern that was much more linear than hockey-stick shaped and that largely flattened after the first four years. However, in the fifth year, 2008, the US economy entered the Great Recession. We see an across-the-board decline in the sales of the KFS companies from 2009 to 2011.
We also discovered that in those early years, gross sales exceeding $1 million were rare, with the mean revenue for the surviving KFS companies leveling out at just under $900,000. We identified only 70 companies with annual growth exceeding 30 percent year over year for the first three years. We called these gazelles. Their sales climbed much faster than the remainder of the surviving companies but capped out at just under $2.5 million. They didn’t soar to $50 million and beyond. The story of explosive growth told by the press when it covers the darlings of Silicon Valley paints an unrealistic picture for the average entrepreneur seeking to start and grow his or her company.
More importantly, a telling pattern emerged when we removed the 10 percent of companies that reported being sold during the eight-year timeframe, and when we separated the 52 percent of firms that survived from the 38 percent of them that went out of business during the study. Companies that did not learn to sell, whose sales pattern started up in years one and two but flattened out early at less than $400,000, were destined to fail, even if it took seven years.
There is an important lesson here for entrepreneurs and investors: learning to sell—identifying your target customers, improving your processes to acquire new customers, retaining existing customers, and growing the base—happens in the first two to three years of business. If your sales trajectory is not trending up after that time, chances are it never will. Examine your value proposition to your customer, your approach to the market, and your internal sales talent. If you can’t fix these, you may not have a repeatable, scalable business model to pursue after all.
When trying to predict sales patterns, it is also relevant to look at the way companies go to market. We used the North American Industry Classification System (NAICS) codes collected by the Kauffman researchers to organize the companies into four categories, using the typical go-to-market approach:
Relationship selling is typified by a member of a direct-sales force employed by the company interacting one-on-one with an end buyer of the product or service. Individual contracts are customized to the specific buyer’s requirements, and growth means adding buyers one at a time. Most business services, enterprise software, large capital-equipment companies, and some consumer services such as home repair, interior design, and cleaning are sold this way. These companies experienced slow, steady linear growth in the early years, and the impact of the Great Recession was delayed for them, perhaps due to the longer-term nature of the one-on-one contracts.
Entrepreneurs’ sales approach
Online businesses are most likely to show a propensity toward “hockey-stick” growth.
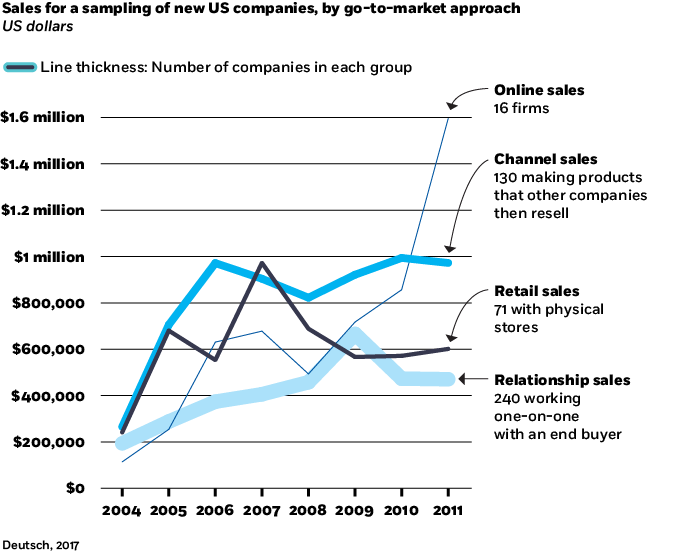
Retailers have physical store locations where they generate revenue from the mix of products and services sold at that location. Many companies selling goods such as groceries, furniture, clothing, and other consumables directly to consumers—as well as companies selling consumer services such as health and wellness, beauty, hospitality, and entertainment—generate revenue by having retail locations. Some business goods and services are also sold in retail locations. Most entrepreneurs starting stores think they will hit steady-state revenue in six months to a year, but our model suggests it takes three years for a retail unit to achieve that. None of the retail-based companies in the KFS opened additional locations during the study period.
Channel sales involve selling a product or service to another company that either resells it directly to the end user or embeds it into a final offering that is sold to the ultimate customer. One example: consumer-goods producers sell to wholesalers and retailers, which sell the products to consumers. This model gained market traction the fastest and appeared to hit steady state, possibly based on production-capacity constraints, in year three.
Online distribution is the newest go-to-market model for soft goods such as content, software, and financial services, as well as an alternative to brick-and-mortar stores for e-commerce companies. While a relatively small percentage of retail goods are sold direct to consumers from online stores such as Amazon.com and eBay, this approach to the market is growing rapidly. And especially in the start-up world, companies increasingly rely on this method of sales and distribution—particularly online-native businesses. These companies are the most likely to demonstrate a propensity toward the hockey-stick curve of exponential growth. The KFS companies in this model seem to have been delayed by the Great Recession but achieved a sharp upward trajectory from 2008 to 2011.
We looked across several elements in the data set to determine what correlated with longer-term survival rates—only in academia do you need a statistically relevant data sampling to tell you what you already know, but it is true: more revenue absolutely correlates with survival rates. So, what are the variables that correlate with higher revenue? We found two.
Capital. When a company has capital to work with, whether it is debt (120 companies in our sample reported accessing an average amount of $178,000 in debt), financing from savings or friends and family (275 reported injecting an average of $70,000 of personal capital into the business), or equity (six companies reported raising an average of $54,000 in equity funding), there is a significant and positive correlation with higher revenue the following year.
Employees. In every year of the study, an increase in the overall number of employees shows strong positive correlation with increased revenue the following year. And more employees dedicated to sales activities correlates with higher revenue.
What can the aspiring entrepreneur take away from all of this? The hockey-stick growth model that gets a company to $50 million, $100 million, or even $1 billion in five years, so touted in the press, exists—but it is rare. Perhaps not unicorn rare, but far less than 1 percent of companies will achieve results even close to that. You need to plan your business accordingly, but there are two things you can do to meaningfully increase your chances of success: give your company enough capital to work with in the early days, and invest some of that money in employees who can sell. In the end, revenue generation is the way to business survival.
Waverly Deutsch is clinical professor of entrepreneurship at Chicago Booth.
Analysis of the data was completed as a result of a generous grant of pro bono services from Civis Analytics and was conducted by Danning Chen with guidance from Carolyn Kriss and Waverly Deutsch.
The VC industry continues to pay lip service to diversity.
Women and Minority Investors Are Taking Matters into Their Own Hands
Successful business pitches still need to focus on a few things.
COVID-19 Isn’t Changing What Investors Want
Four insights from Chicago Booth’s Waverly Deutsch for entrepreneurs hoping to cultivate scalable success.
How to Start-UpYour Privacy
We want to demonstrate our commitment to your privacy. Please review Chicago Booth's privacy notice, which provides information explaining how and why we collect particular information when you visit our website.