
It’s Time the US Abolished the Income Tax
Bring on the consumption tax.
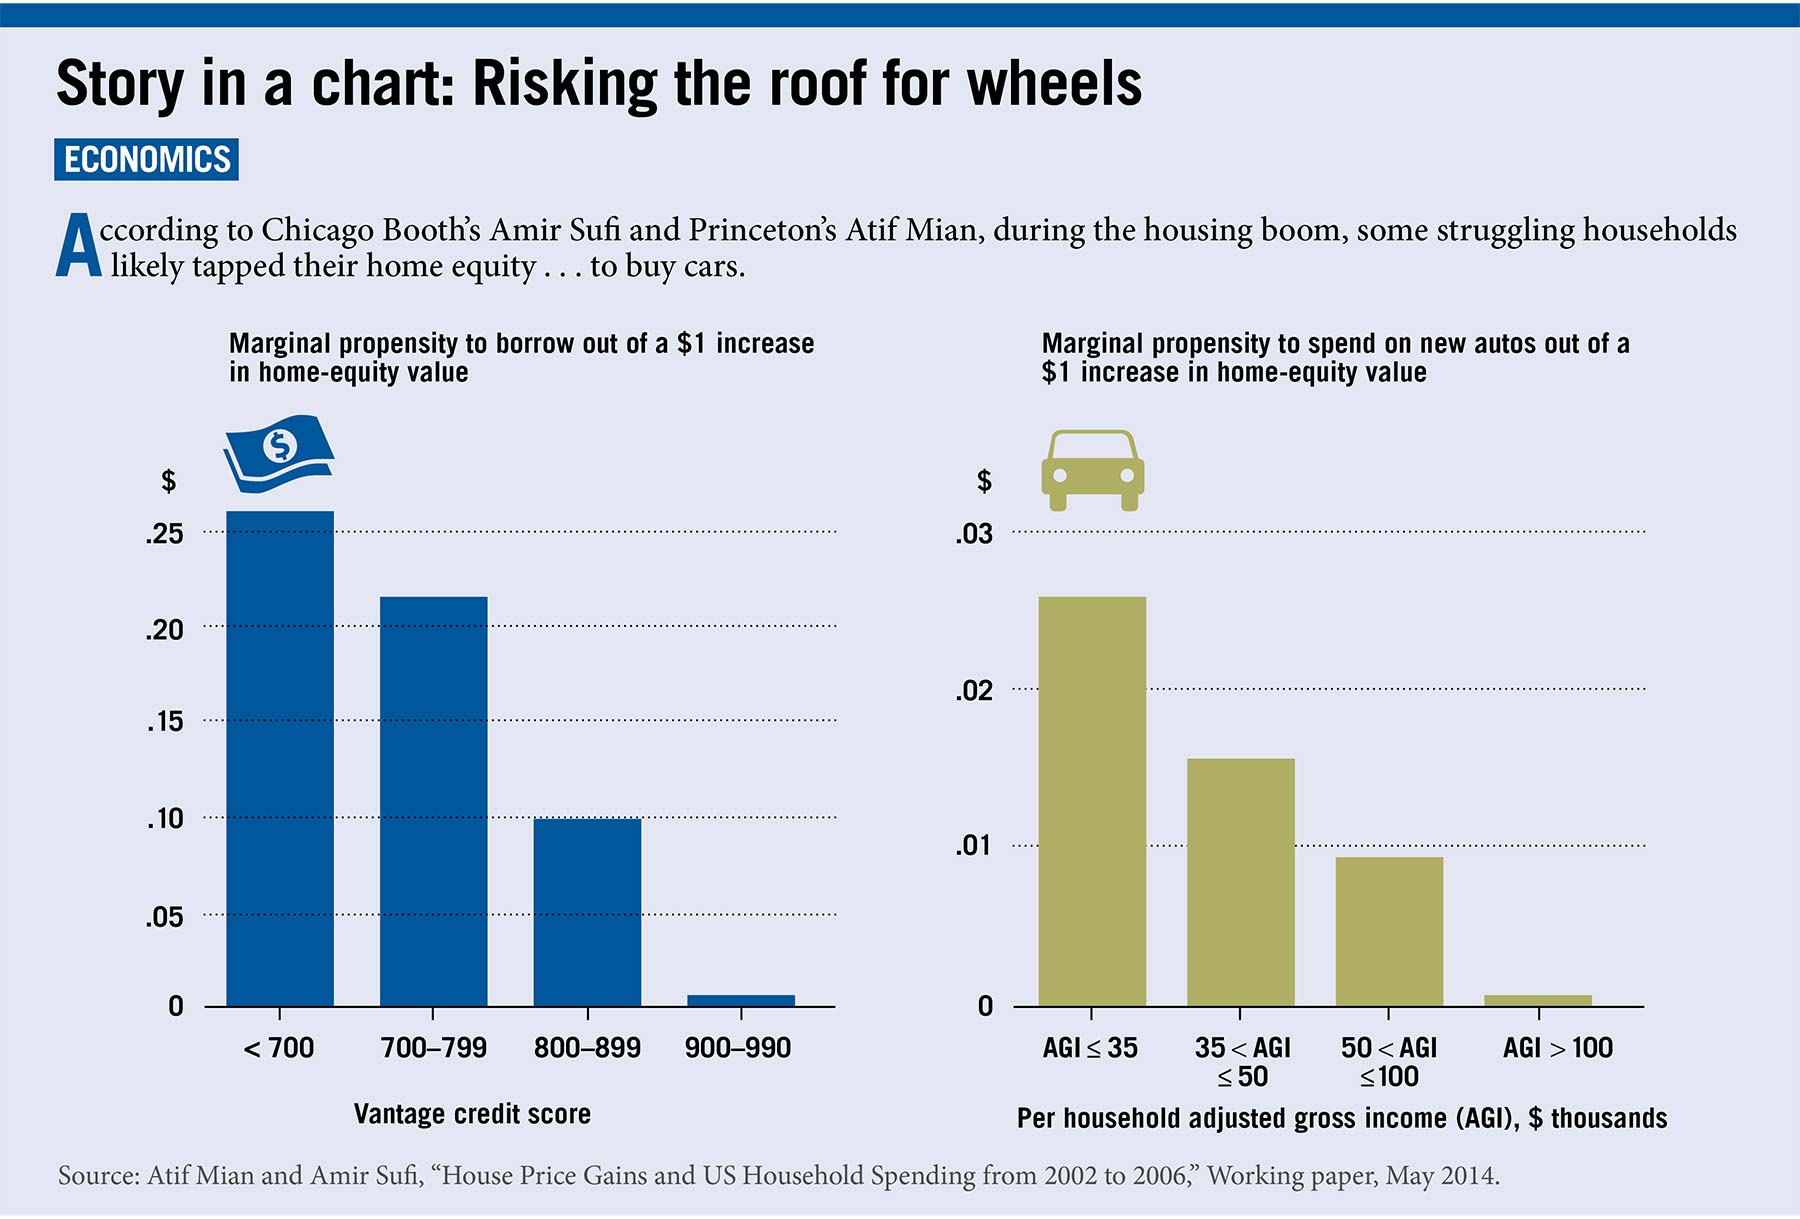
It’s Time the US Abolished the Income TaxThe 2002–06 US home-price boom was an egalitarian wealth creator in America, increasing the net worth of corporate executives and low-income workers alike. But rich and poor homeowners reacted differently to these intangible windfalls, according to Chicago Booth’s Amir Sufi and Princeton University’s Atif Mian. The rich, and much of the middle class, largely ignored the gains. Lower-income homeowners used their newfound collateral to borrow and spend more money. Temporary access to credit for the poorest homeowners greatly lifted US economic growth, but set the stage for a more intractable bust to follow.
US home prices rose an average 36 percent between 2002 and 2006, adding $54,000 to the price of an average home. Quantifying the effect these changes had on consumer spending, Sufi and Mian find that rising housing values added 3.5 percent to gross domestic product in the four-year period.
This broad economic effect, the researchers find, came almost exclusively from the poorest homeowners in America loading up on debt. Homeowners in households earning less than $50,000 a year were far more likely than higher-earning owners to refinance their mortgages into cash-out loans as home prices rose. In cash-out transactions—the most popular way of tapping into home equity in the United States—the homeowner uses a new, bigger loan to pay off the original, and pockets the difference.
Lower-income homeowners also bought more new cars than usual when home prices were rising. Of all the income groups, the lowest-earning households increased spending on cars the most.
In contrast, the borrowing and spending habits of wealthier homeowners were largely unaffected by the rising values of their homes. Households earning $100,000 or more annually were no more likely to conduct cash-out refinancing between 2002 and 2006 than normal. There was little change in their patterns of new-car purchases.
Sufi and Mian surmise that GDP rose during the housing boom because the poorest homeowners suddenly gained the collateral needed to borrow more. Households earning less than $50,000 annually typically have few good options for borrowing large amounts of money. They tend to have little cash on hand and little to offer as loan collateral. But rising home values can make even these homeowners eligible for cash-out refinancing with hefty payouts. A homeowner who owes $80,000 on a $100,000 house, for example, would be maxed out for a conventional mortgage. But if the value of the house rises 20 percent (a not-uncommon occurrence during that period), he could increase his loan that much and pull out roughly $20,000 in cash.
The price rise gives homeowners access to more cash even if their wages are stagnant and they’ve made no progress on paying down the loan principal.
When home prices collapsed, however, low-income borrowers suffered the most. Between 2006 and 2011, this group experienced the largest relative decline in income and spending. With underwater mortgages, their excessive debt loads and weaker earnings likely have barred them from credit markets since.
The fate of the poorest homeowners helps explain the ongoing sluggishness of the US economy today, despite a hearty rise in home prices since 2011, the researchers explain. Debt-fueled spending by low-income homeowners that powered up GDP in the last housing boom isn’t possible now, because those homeowners do not have the collateral needed to borrow more this time. Higher-income homeowners aren’t likely to tap home equity simply because values rise. As a result, gains in home prices are unlikely to affect consumption now.
Sufi and Mian’s research is unique in detailing how homeowners of varying income levels borrow and spend differently when home values rise quickly. In a 2011 paper published in the American Economic Review, Sufi and Mian demonstrate that younger households and those with low credit scores had a much stronger propensity to borrow between 2002 and 2006 than their counterparts.
This latest research goes further, demonstrating for the first time how lower-income homeowners markedly increased their new-car spending as well as their borrowing when home prices rose, while other households made few changes. New consumption data allowed the researchers to quantify the effect that home-price rises had on the economy as a whole.
The researchers studied data encompassing both geographic areas and individual households from several sources. The IRS’s Statistics of Income program gave them per capital adjusted gross income in 2002, which they used as a primary measure of cash on hand by zip code. Analytics company CoreLogic supplied home-price-growth data by core-based statistical areas.
CoreLogic also supplied new data that show the share of outstanding mortgage debt in a zip code that was refinanced in cash-out transactions. The researchers used this information to measure cash-out activity in years when home prices were rising or falling versus periods of relative stability.
The study finds that a 20 percent increase in house-price growth in a zip code from 2002 to 2006 created a three-percentage-point rise in the annual share of outstanding mortgages that are refinanced in a cash-out transaction. But this effect was seen almost exclusively in zip codes where the average 2002 income was less than $50,000 per household. There was little change in cash-out activity when household income averaged $100,000 a year or more.
New-car sales were used as a measure of consumer spending, because unlike other spending data sets, this information was available at the zip-code level. Automotive consulting firm R.L. Polk & Co. supplied these numbers, which were based on vehicle-registration information that lists the address of the person buying the vehicle.
These sales indicate that the lowest-income households did not put their new loan proceeds toward savings, but spent that cash. Examining the propensity of homeowners in each income group to buy a new car in 2006, compared to their likelihood to make that purchase in 2002 or earlier, the researchers find a jump in propensity to buy a new car in lower-income zip codes, especially where annual household income averaged less than $35,000. (The researchers ruled out the possibility that sudden increases in income sparked this buying.) Car-buying habits of the most-wealthy homeowners were relatively unchanged.
The study is largely limited to zip codes with a large number of home sales, the vast majority of which are in urban areas. However, the researchers also looked at credit scores, education levels, and income and debt over time of 60,856 anonymous homeowners from 1997 to 2010. The analysis, using data from credit-reporting company Equifax, confirmed that borrowing and spending patterns in individual households followed the trends established using zip-code data. Individuals with the lowest credit scores, for example, were the most likely to borrow and spend more when home prices rose.
The research indicates that the housing-wealth effect—a well-accepted principle that suggests homeowners spend more when values are rising simply because they feel richer—is really a housing-debt effect. In other words, the feel-good effect that comes from seeing the value of one’s home shoot higher isn’t enough to change spending habits. It’s actual extra cash from new mortgages that leads homeowners to spend more money. The economic gains attributable to home-price rises come almost exclusively from the heavier debt burdens that the lowest-income homeowners take on as a result.
Bring on the consumption tax.
It’s Time the US Abolished the Income Tax
Government-supported re-skilling can be good for workers and taxpayers.
Line of Inquiry: Anders Humlum on How to Help More Injured Workers
Booth’s Raghuram G. Rajan and Martin Wolf of the Financial Times discuss the pressures faced by democratic systems.
How Can We Restore Trust in Democracy?Your Privacy
We want to demonstrate our commitment to your privacy. Please review Chicago Booth's privacy notice, which provides information explaining how and why we collect particular information when you visit our website.