
What Will Move the Global Economy in 2024?
An expert panel discusses some of the most important risks and trends facing investors, executives, and policy makers.
What Will Move the Global Economy in 2024?With unemployment rising to its highest rate since the Great Depression and labor participation plummeting, many local-government leaders in the United States have taken steps to reopen their cities, worrying not only about the financial cost of keeping large parts of the economy frozen but also about the implications for public health, as job loss, income insecurity, food insecurity, and lack of access to health care among the unemployed can all contribute to mortality.
But research suggests that some methods of reopening local economies generally favored by policy makers, such as focusing on certain types of businesses across an entire city, are costlier than a more geographically targeted, neighborhood-by-neighborhood approach, according to Chicago Booth’s John R. Birge and Ozan Candogan and Northwestern PhD candidate Yiding Feng.
Local urban planners, in coordination with neighboring counties and state government, can reduce overall infections within a city while preserving vital economic activity by strategically keeping some neighborhoods shut down while allowing others to serve as hubs for commercial activity, the researchers find.
Policy makers have generally favored uniform approaches, regarding them as easier to implement as well as to sell to a fairness-minded public. But Birge, Candogan, and Feng find that the economic sacrifices of a blanket approach are three to four times greater than when deliberately targeting neighborhoods.
The researchers identify to what extent every zip code would have to remain locked down in order to maximize economic output in Midtown and other key areas while minimizing further infections.
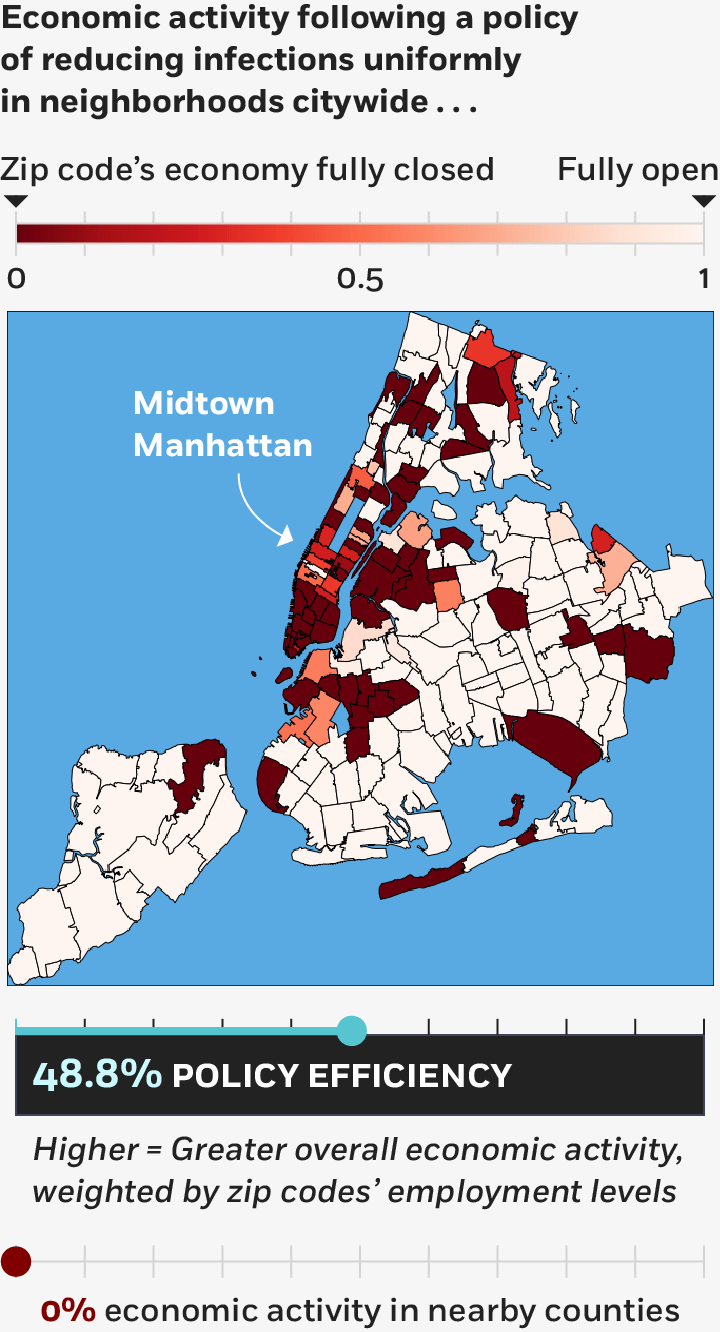
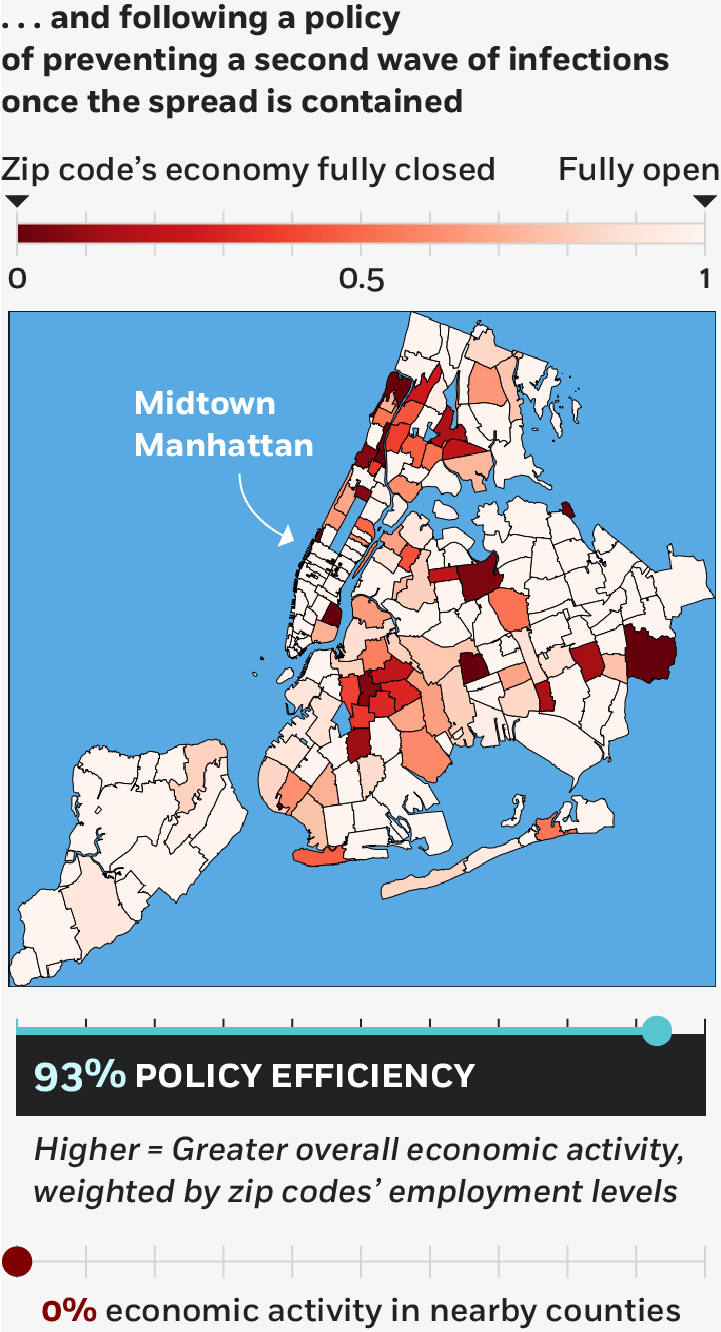
Birge et al., 2020
The researchers looked at quarantines and economic shutdowns in spatial and geographic terms, with the goal of finding a way to bring down overall infection rates at the lowest possible economic cost. In their model, some urban neighborhoods and public spaces may serve as hotspots for disease transmission and should be targeted for closure—and yet, certain hubs of vital economic activity could remain open, they write.
Take New York City, for example. In scenarios involving an outbreak of a highly infectious or even a moderately infectious disease, Midtown Manhattan is such a hub for substantial economic activity that it should be strategically spared a shutdown, while other neighborhoods, including the city’s financial district in lower Manhattan, should be almost completely shuttered, according to the model. Midtown is an economic juggernaut, and the cost of shutting it down is just too high, given the opportunities to better control disease spread elsewhere, the researchers argue.
“Counter to naive intuition, the neighborhoods where the economic activity should be reduced the most are not those with the largest infection rates,” they write. “Even among adjacent neighborhoods with similar economic values, it may be optimal to resume activity at those with higher infection rates depending on the structure of the spatial spread patterns between these neighborhoods and the others.” The idea is to pick key economic hubs such as Midtown, and then use largely the rest of the city to control the pandemic.
While the calculations for the maps above assume neighboring counties in New Jersey and elsewhere keep their economies fully locked down, these maps report the results if those counties’ economies were operating at 80 percent of their normal levels.
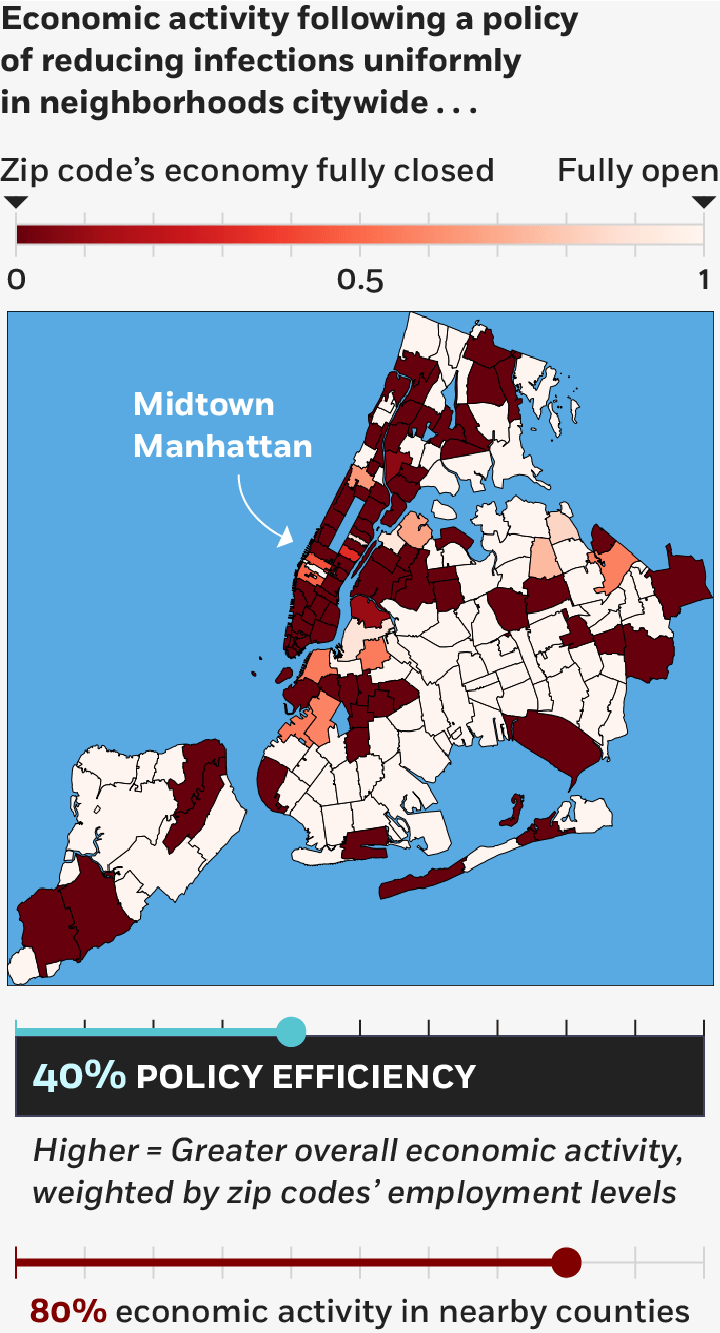
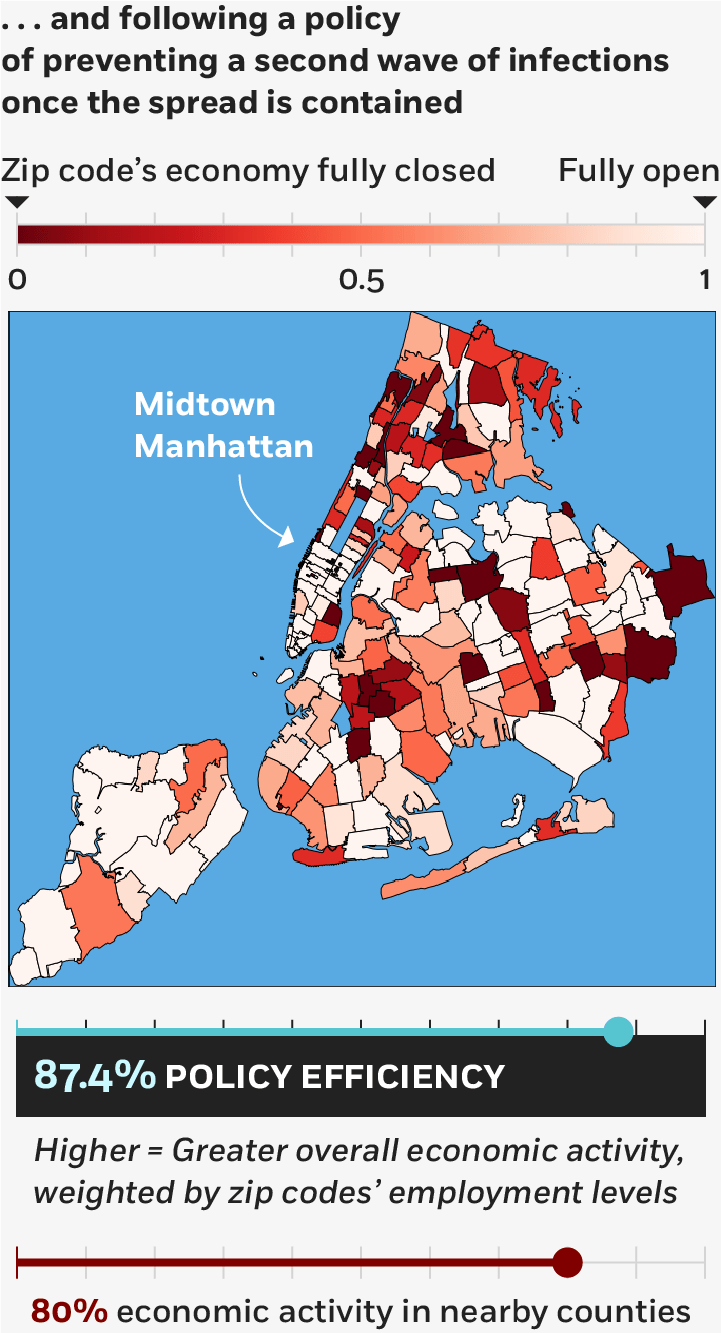
Birge et al., 2020
Effectively targeting urban neighborhoods will depend on coordination with other local and state governments. New York City doesn’t exist in isolation, so a refusal to halt activity by counties in New Jersey, for example, can undo even the best-laid plan for Manhattan.
Meanwhile, because of the interdependence of neighboring communities, this single-city model might be scalable to the country, enabling federal planners to more effectively deal with larger pandemics.
John R. Birge, Ozan Candogan, and Yiding Feng, “Controlling Epidemic Spread: Reducing Economic Losses with Targeted Closures,” Working paper, May 2020.
An expert panel discusses some of the most important risks and trends facing investors, executives, and policy makers.
What Will Move the Global Economy in 2024?
Booth’s Raghuram G. Rajan and Martin Wolf of the Financial Times discuss the pressures faced by democratic systems.
How Can We Restore Trust in Democracy?
Older, quirky homes can be cheaper, but also harder to obtain financing for.
Need a Mortgage? Banks Prefer Modern, Standardized HousingYour Privacy
We want to demonstrate our commitment to your privacy. Please review Chicago Booth's privacy notice, which provides information explaining how and why we collect particular information when you visit our website.